Methodological comparison between fiber photometry and miniaturized endoscopes
ABSTRACT
Over the last decade, developments in calcium imaging have provided helpful tools for the study of brain function. This review describes recent advances in the field, especially regarding the two main techniques used to record neurophysiological activity in freely moving animals: fiber photometry and miniaturized endoscopes (miniscopes). Fiber photometry is used to investigate bulk activity changes in synchronous-firing neuronal populations while miniscopes can be used to visualize neuronal activity at the single-cell level. This review compares the implementation (e.g. technical considerations, surgeries), data acquisition, and data analysis of both techniques, providing insights into the types of research questions suitable for each method.
1 INTRODUCTION – A BRIEF HISTORY OF CALCIUM IMAGING
To study brain function in the context of Behavioral Neuroscience, various manipulations of brain activity such as pharmacology, optogenetics, or chemogenetics have been used. These interventionistic methods of study allow scientists to make claims of function in a counterfactual manner: “activity of cell-type X in brain region Y is necessary and sufficient for behavior Z”. However, if one wants to observe patterns that emerge in the animal’s brain in a more naturalistic way, methods of direct assessment of brain activity are necessary.
One such method is in vivo recording of electrophysiological parameters, which provides unparalleled temporal accuracy and accurate estimation of spike timing of single units (Li et al., 2019). For decades, the field was predominantly attempting to unveil mechanisms of information encoding at the single-cell level, using techniques as patch-clamping in slices of brain tissue. The idea of using multicellular electrophysiology to assess simultaneous brain activity in vivo was met with significant skepticism: the brain was thought to be too complex to be usefully reduced to the encoding properties of only a few dozen single-units (Nicolelis, 2011). This was first proven wrong in the late 90s, in an experiment that demonstrated that the activity of 30-40 neurons accurately encoded the information of the location of a tactile stimulus (Nicolelis et al., 1998). Since then, in vivo electrophysiology has seen significant advances, culminating in inventions such as the neuropixel probe (Jun et al., 2017), which can record thousands of single units simultaneously in multiple brain regions.
In line with the growing interest in the investigation of neuronal population dynamics, calcium imaging technology has evolved concurrently. Initially, this method was performed with small calcium-sensitive dyes (Cobbold & Rink, 1987), and more recently with genetically encoded calcium indicators (GECIs) such as GCaMP (Nakai, Ohkura, & Imoto, 2001). The main advantage of GECIs over calcium-sensitive dyes is that they can be expressed long-term and can potentially bypass invasive loading procedures with the use of transgenic lines.
Calcium imaging utilizes a reporter that transforms calcium availability – which is a second-order effect of cell activity – into a fluorescent signal (Scanziani & Häusser, 2009). Therefore, this method is necessarily indirect, and it consequently has a poorer temporal resolution than electrophysiology due to limitations intrinsic to the dynamics of the calcium indicator. However, calcium imaging has a great advantage over in vivo electrophysiology, which is the ability to target specific neuronal-projections, cell-types, or even subcellular structures, allowing for microcircuit-level studies (Campos, 2019).
In vivo calcium imaging has commonly been performed with head-fixed animals and two-photon microscopy. Two-photon microscopy has several advantages over one-photon/widefield microscopy, including better tissue penetration, less phototoxicity due to the use of longer wavelengths, and the fact that excitation light is focused on a very narrow focal plane, resulting in a better signal-to-noise ratio (Helmchen, 2009). However, the necessity to head-fixate animals and the average price of a two-photon setup being around half-a-million dollars (Girven & Sparta, 2017) has instigated the necessity to search for cheaper 1-photon alternatives that could be used in freely moving animals. Furthermore, a comparison of the same sample under one-photon and two-photon microscopy have shown that both techniques yielded the same neurons in the image stack and with a similar pattern of signal acquisition (Glas et al., 2019), implying that one-photon can yield similar results to two-photon approaches.
This review will discuss two main techniques of one-photon in vivo calcium imaging that allow Behavioral Neuroscience studies in freely moving animals: fiber photometry and miniaturized endoscopes (miniscopes). Each technique will be examined and compared in multiple aspects, including surgeries, impact on behavior, data interpretation, and data analysis. We will describe which technique is more appropriate based upon one’s research question and conclude with perspectives for the field of Behavioral Neuroscience, indicating current limitations and how they could be overcome with future technological advances.
2 GCAMP USAGE IN CALCIUM IMAGING
Neuronal activity is primarily an electric phenomenon which can be visualized directly using voltage indicator probes (Barnett et al., 2012), or indirectly by targeting molecules that increase in concentration as a result of cell activity, such as fluorescent biosensors for neurotransmitters (Marvin et al., 2013) or ion sensors (Arosio & Ratto, 2014). The use of voltage indicator allows for a greater temporal resolution, but their use is currently limited due to poor signal-to-noise ratio (Resendez et al., 2016). The remainder of the review will focus mainly on calcium indicators as they are the most commonly used probe for FP and miniscopes.
One of the numerous downstream consequences of neuronal activity is the increase in intracellular calcium (Ross, 1989). Calcium is important as second-messenger for many biological functions: G-protein coupled receptor activation cascades (Ma et al., 2017), neurochemicals exocytosis (Augustine, Charlton, & Smith, 1985), and synaptic plasticity (Zucker, 1999). Because calcium has a very low intracellular concentration when a neuron is inactive (0.05-0.1 mM) and a significantly higher concentration when a neuron is active (0.7-1 mM), it is a reliable target for optic probing, with a distinguishable signal-to-noise ratio between both states of activity (Oh, Lee, & Kaang, 2019).
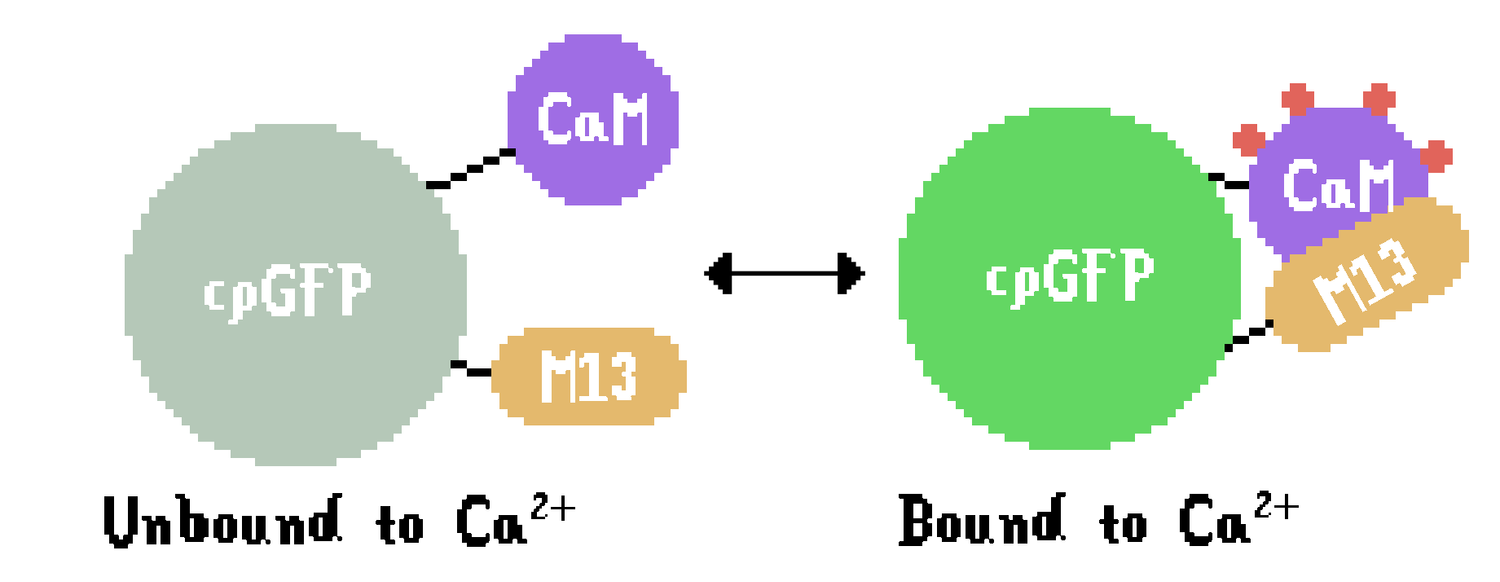
The GCaMP protein is comprised of three portions: cpGFP (a fluorescent indicator), calmodulin (a highly sensitive calcium sensor), and M13 (a small peptide that allows a dynamic change between active and inactive states). cpGFP becomes fluorescent when excited with light in the blue color-range (around 470-490 nm). Because some energy is lost to vibration, the emitted photons from the reporter are in the green color range (around 510 nm). The difference between excitation and emission light is called Stokes Shift, and it allows the separation of excitation and emission photons with optical filters (Berezin & Achilefu, 2010).
The molecule of GCaMP has two conformations (Figure 1): unbound to Ca2+, which emits less fluorescence, and bound to Ca2+, which has a different protonation state (Barnett, Hughes, & Drobizhev, 2017) and results in a different protein conformation that emits significantly more fluorescence compared to the unbound conformation – for instance, a variant of GCaMP with fast kinetics (GCaMP6f) fluoresces 27 times more in a calcium-saturated state compared to a calcium-depleted state (Farhana et al., 2019). Because of the pronounced 7- to 20-fold increase in calcium availability during the active neuronal state compared to the inactive state, GCaMP fluorescence can, therefore, serve as a reliable indicator of intracellular calcium concentration, which is, in turn, an indirect measurement of neuronal activity.
GCaMP is an intensiometric indicator, which means that the fluorescent signal observed depends on the concentration of GCaMP in the animal’s brain. It is necessary to be cognizant of GCaMP photobleaching – i.e. the excitation light causes the degradation of GCaMP molecules – throughout a recording session. These two factors complicate the data analysis comparisons (1) between animals since different organisms will inevitably have different intracellular GCaMP levels, and (2) in the same animal because the bleaching will decrease baseline fluorescence at different timepoints of training. This is commonly addressed by using a ratio of fluorescence between active periods and baseline (ΔF/F, see Section 8.1): although the absolute magnitude of GCaMP fluorescence might be different, the relative proportion of activity over baseline should be approximately the same, which allows comparisons of the signal within the same animal at different points in time, and also between different animals.
The potency of calcium indicators has significantly improved since the development of the original GCaMP probe (Nakai et al., 2001). Every iteration has roughly led to a 1.5-2x improvement of signal linearity and sensitivity (Akerboom et al., 2012; Chen et al., 2013; Tian et al., 2009). Recent innovations include the development of jGCaMP7, which has on average has 40% greater ΔF/F compared to its predecessor GCaMP6 (Dana et al., 2019), and XGCaMP, which has a four-color suite of probes which can be used for multi-color imaging (Inoue et al., 2019). Multicolor calcium indicators can be applied with photometry systems, allowing the observation of two GECIs with different excitation spectra simultaneously. This allows, for instance, the combination of a red-shifted calcium indicator combined with a green-fluorescent probe for dopamine (Beyene et al., 2018) or simultaneous photometry measurements with optogenetics intervention in the same brain region (Sych et al., 2019). The advantages of multicolor GCaMP suites are less applicable to miniscopes because GRIN lenses are not appropriate to be used with red/far-red indicators (Ghosh et al., 2011).
There are several challenges when using this probe: GCaMP interferes with the kinetics of L-type calcium channels (Yang et al., 2018) and there is a strong buffering of intracellular Ca2+ which may lead to cytotoxicity (Resendez et al., 2016). These problems can partially be avoided by reducing intracellular GCaMP levels, at the cost of a poorer signal to noise ratio. Therefore, an initial dilution study is often recommended to determine optimal GCaMP expression for FP and miniscope implementation. Furthermore, abnormalities in brain function have been reported in transgenic GCaMP lines (Steinmetz et al., 2017). Transgenic lines can be replaced by cre-dependent lines to bypass this problem, but that requires an additional virus injection in the target brain region.
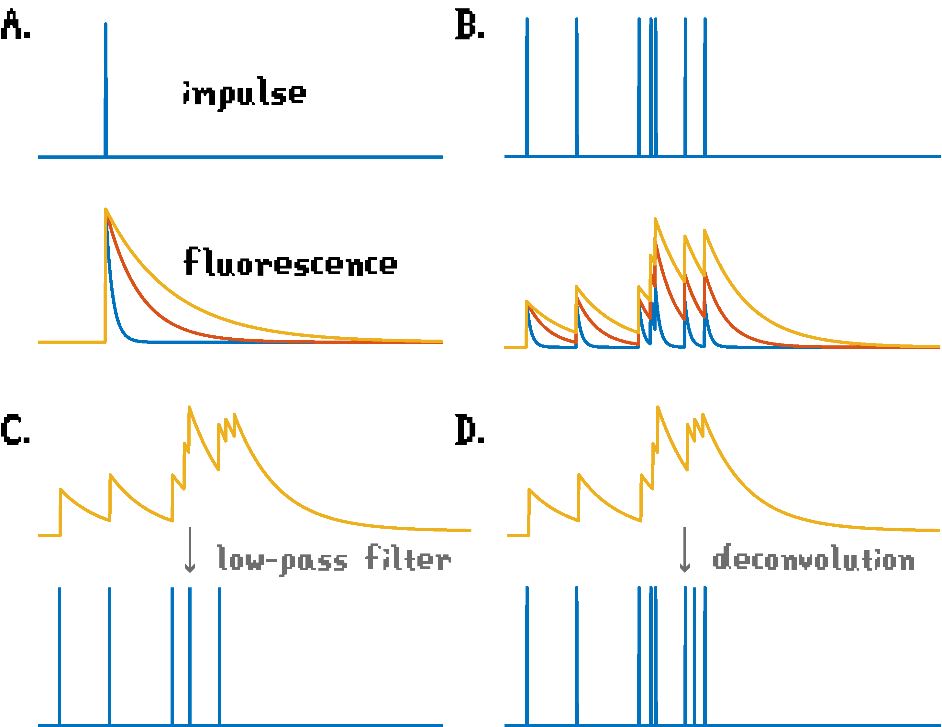
In the context of Behavioral Neuroscience, GCaMP data is often synced with behavioral data, usually by performing a low-pass filter to infer spiking activity based on the fluorescence data. Because there are GCaMP molecules with different kinetics, the output data depends on the decay time of the probe used (Figure 2A). A confounding effect of the inference of spiking activity is the fact that the concentration of calcium in the neuron remains elevated after activity – such that a 1 ms action potential can potentially increase GCaMP fluorescence for 1-10 s (Sabatini, 2019). This has a consequence of reducing the correlation of fluorescence data and the true spiking, such that slower the kinetics of GCaMP, the poorer this correlation is (Figure 2B). When using a slow GCaMP variant, the utilization of a simple low-pass filter processing results in the obfuscation of fast-consecutive spikes, which could result in false-negative findings (Figure 2C) (Sabatini, 2019). This problem can be minimized by performing deconvoluting processing, i.e. using a more complex algorithm that accounts for GCaMP kinetics and the temporal information of the spiking activity to accurately infer cellular activity. (Figure 2D)
In summary, GCaMP is one of the most commonly used and most rapidly developing GECIs in the field of neuroscience because it is one of the best optic probes in terms of signal-to-noise ratio and the fact that calcium influx is a reliable biological metric of neuronal activity. However, it is necessary to keep the limitations of GCaMP in mind: (1) it may have effects on normal physiology, especially when overexpressed in the cell. This can be minimized by an initial dilution study before the experiment; (2) it is not a real-time probe since the activity spike occurs before the influx of calcium. This, in turn, can be corrected by adding a deconvolution step in the data analysis.
3 FIBER PHOTOMETRY (FP)
FP is a calcium imaging method that uses a single patch cable, connected to an implanted fiber, to guide both excitation of the fluorescent probe and collection of the fluorescence signal (Figure 3). The light emitted by GCaMP in the brain of the animal can be subsequently separated with optical filters before reaching a highly sensitive detector. This analog input is converted into a digital signal: a one-dimensional trace that represents the fluorescence output of all GCaMP-tagged neurons within range of the fiber tip. Compared to traditional techniques such as electrophysiology, FP is more efficient in terms of data collection and ease of use, more stable for long-term analysis, and less expensive (Li et al., 2019).

While it lacks spatial information, FP is useful to study bulk activity of specific neuronal populations, since GCaMP can be expressed in specific cell types. Furthermore, because FP uses either a low-noise amplified photodetector or a photomultiplier tube, it has a sensitivity in the level of single photons, allowing detection of low levels of activity in soma, dendrites, and axons (Dana et al., 2019). The use of a lock-in amplifier and high sensitivity detectors also allow for multiple hour-long recordings over multiple weeks with minimal signal loss due to low excitation light intensity required (Simone et al., 2018). Furthermore, it is possible to implant several fibers to assess the activity of multiple brain regions simultaneously (Kim et al., 2016) due to the relatively small size of the implant (200-400μm).
Traditional FP has a larger cone of detection (200-450 μm) (Kupferschmidt et al., 2017; Pisanello et al., 2018) compared to the relative narrow z-resolution of the miniscope (33.35 μm per plane of focus) (Glas et al., 2019). Recent developments with tapered fiber tips allow for light collection up to 2000 μm depth, while their decreased surface area also reduces the amount of tissue damage (Pisano et al., 2019). Therefore, FP seems to be the most appropriate option to study the dynamics of sporadically tagged neurons, since it is unlikely that miniscopes would capture multiple cells from a sparse neuronal population within a single detection plane.
In summary, FP is used to assess bulk activity of neuronal populations in freely moving animals. The main limitation of the technique is the lack of spatial information, which makes it possible to use more sensitive detectors and have a great volume of acquisition, while simplifying several steps of implementation (surgery, data acquisition, and data analysis), making it a relatively straightforward technique to establish in the lab.
4 MINISCOPES
For a long time, the main limitation of one-photon calcium imaging was that brain tissue presents high levels of light scattering (Bollmann & Engert, 2009; Hamel et al., 2015), which explains why miniscopes were initially developed with two-photon technology. The original system essentially connected excitatory light from a two-photon tabletop system into a fiber that could be implanted in the animals’ head, with the original implant weighing about 25 g (Helmchen et al., 2001). While other lighter two-photon miniscopes have been developed and used successfully since then, the technical challenges of optical limitations, inferior sampling rates, and movement artifacts originating from the use of long wavelengths in femtosecond pulses (Silva, 2017) have instigated the search for one-photon miniscope alternatives.
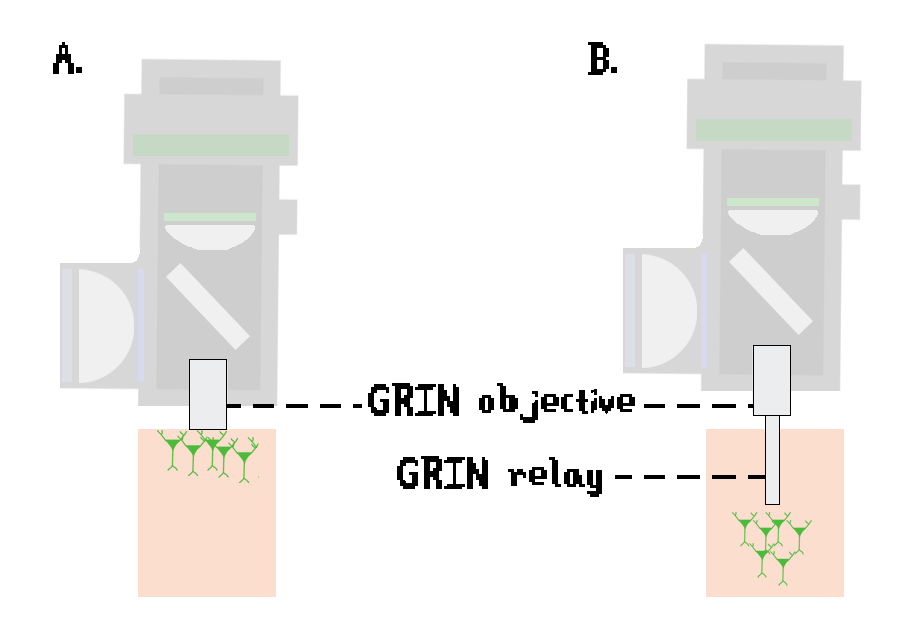
The problem of one-photon light scattering and consequent inability to reach more deeply than a few millimeters in the brain (Ouzounov et al., 2017) has been partially addressed by the development of GRIN lenses. GRIN lenses have a radially-varying index of refraction, which maximizes the amount of light that reaches the sensor while minimizing optical aberrations (Barretto, Messerschmidt, & Schnitzer, 2009). The miniscope contains a GRIN objective (1.8 to 2.0 mm diameter; Figure 4A), which is sufficient for cortical imaging (Aharoni & Hoogland, 2019). Deeper brain regions require implantation of a second GRIN relay lens (ranging from 500 μm to 1000 μm in diameter; Figure 4B).
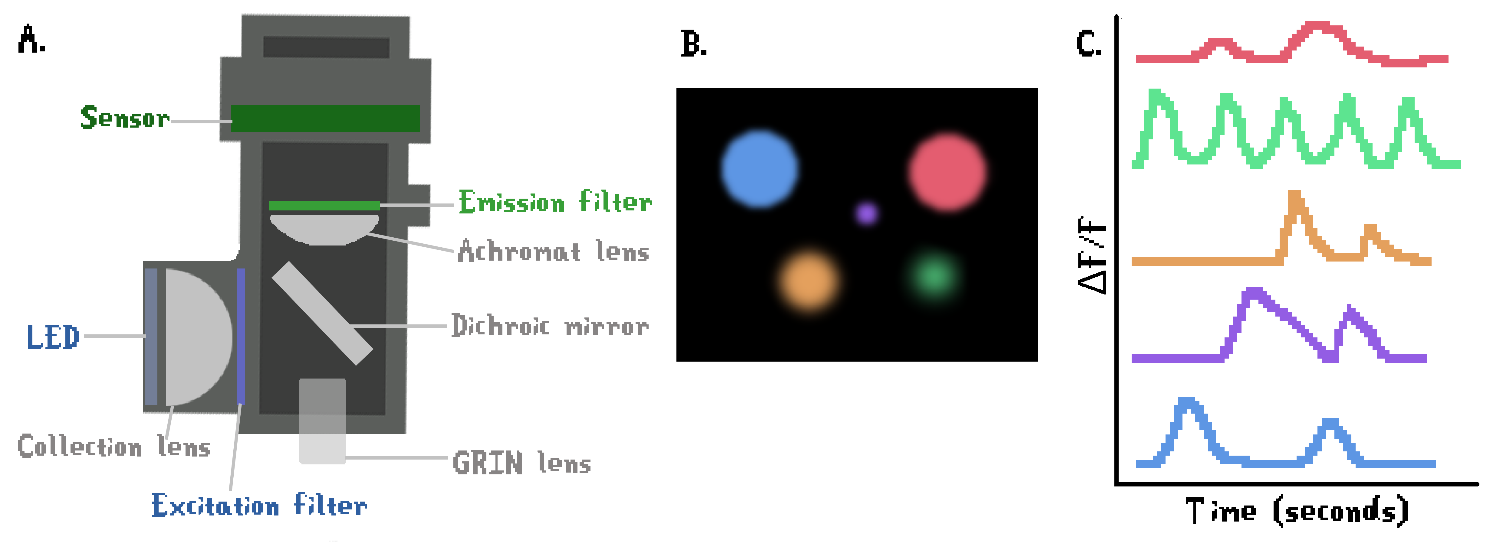
The first one-photon miniaturized microscope that allowed for single-cell resolution was developed first by the Schnitzer group at Stanford (Ghosh et al., 2011). Advances in miniaturization technology were used to replace the main components of a traditional widefield microscope with something that the animal could carry on top of its head: they replaced a lamp with a LED, a huge CCD sensor with a tiny CMOS sensor and a big objective by a small GRIN lens (Figure 5A). The development of miniscopes was a substantial advance for Behavioral Neuroscience: miniscope data allows researchers to visually observe the same neuronal population over multiple weeks (Figure 5B) while distinguishing the contributions of single neurons to behavior (Figure 5C).
The use of miniscopes poses technical challenges involving surgery, impact on behavior, and data analysis, which will be described in the following sections (see Sections 5, 6, and 7). Other disadvantages include that there are no waterproof miniscopes, rendering it unfeasible for behavioral paradigms such as the Morris water maze or the forced swim test (Resendez & Stuber, 2015). Furthermore, modern miniscopes systems have limited acquisition frame rates, precluding the use of temporally precise voltage-sensors (Hamel et al., 2015).
In summary, miniscopes can provide significantly more information than fiber photometry: rather than collapsing all information into a single dimension, miniscope data preserves the spatial organization of the neurons in the field-of-view. However, while providing single-cell resolution, the system is more technically challenging to implement and more difficult to analyze.
5 SURGERY
FP and miniscope both require stereotactic surgery to ensure accurate implant placement. Surgical procedures are similar: (1) Virus injection to express GCaMP (when not using a transgenic line); (2) implantation of fiber/GRIN lens; (3) headcap placement; (4) for miniscope, baseplate placement to allow secure connection of the device onto the headcap. When using a viral expression of GCaMP, both techniques benefit from a preliminary dilution study, in which multiple concentrations of the virus are tested. The goal is to have optimal GCaMP expression, which is visually expressed throughout the cytosol, but not the nucleus (Resendez et al., 2016), since overexpression will lead to excessive buffering of calcium ions and eventual cell death (Grienberger & Konnerth, 2012).
The placement of implants requires similar steps for both techniques: making a craniotomy, dura removal, and placement of the fiber or GRIN lens. However, a few complications may arise in the miniscope surgery due to the greater size of the implant. Large GRIN lenses also increase intracranial pressure, potentially leading to shifts in virus diffusion and subsequent mistargeted GCaMP expression. To minimize this issue, one could inject a 15% d-mannitol to reduce intracranial pressure before drilling the holes in the skull (de Groot et al., 2020).
GRIN relay lenses (500 μm –1000 μm) are significantly more damaging to the brain than a fiber implant (200 μm – 400 μm) because a two-fold increase in diameter will result in a four-fold increase in volume (and thus four times more damaged or displaced cells). An important consideration is that the relative impact of the implant diminishes with the size of the animal model. For example, an implant of the same size will induce a proportionally higher volume of damage in a mouse brain, which weighs between 0.4-0.5 g, compared to a rat brain, which weighs around 2 g (Bolon & Butt, 2011).
The amount of tissue damage is also dependent on the brain region of interest: the more ventral in the brain, the larger the GRIN relay lens needs to be to assure proper signal acquisition, and consequently more tissue needs to be removed for the implant. This may preclude one from using the miniscope in ventral brain regions – such as the OFC – since a significant volume of dorsal tissue would need to be removed, which could lead to confounding behavioral effects.
To summarize, even though the surgery steps are similar for FP and miniscopes, the difference in implant size needs to be taken into account in the experimental design, both for which animal model to use and for which brain region one is trying to collect data from.
6 IMPACT ON BEHAVIOR
FP and miniscope systems both require headcaps and the attachment of cables. Important considerations for behavior are: 1) Secondary consequences of individual housing; 2) Induction of stress related to the attachment of the animal to the device and; 3) Limitations of movement as a consequence of the size and weight distribution of the apparatus.
Because the animals have a reasonably fragile implement permanently attached to the top of their heads, most protocols for FP and miniscopes advise that researchers put their animals in individual housing after surgery. Studies have shown that single housing, even in an enriched environment, leads to significant changes in stress levels (Krohn et al., 2006), therefore leading to an unknown source of unsystematic bias in behavioral studies (Manouze et al., 2019).
The connection between headcap and device is different between the two techniques: attaching a cable to the animals headcap for FP is a matter of sliding a cable into a ferrule and can be performed by a single person. On the other hand, the miniscope needs to be fixed onto the baseplate with two screws, which can be more stressful for the animal. Some protocols recommend brief anesthesia every time the animal needs to be attached or detached from the miniscope (Yang et al., 2015), which is problematic because repeated anesthesia has significant side-effects on the animal’s health (Hohlbaum et al., 2017) and a long-lasting effect on brain activity (Wu et al., 2019). An alternative is to perform extensive habituation, which could be aided by work with custom head-fixed setups in which the rodent can run on a treadmill (de Groot et al., 2020) while the scope is being attached to reduce the stress of the animal. The latter setup requires more extensive habituation of the animal to the setup, while also being more expensive and laborious because it requires two researchers – one who holds the ring in place and the other who secures the miniscope with screws.
The miniscope headcap covers a larger skull surface area and volume compared to the fiber photometry headcap. The ring-shaped structure that supports the baseplate for the miniscope usually weighs a few grams (Resendez et al., 2016), which is often unaccounted in the miniscope weight. In terms of direct influence on behavior, it is important to consider the weight of the devices – with the photometry fiber is lighter than the miniscope device – but also how the weight is distributed: although miniscopes have become as light as 1.6 grams (de Groot et al., 2020), they still have a high center of gravity compared to fiber photometry. This creates a stronger torque and potentially interferes more intensely with the animal’s vestibular system, especially for mice compared to rats due to their smaller body size.
To summarize, even though the size of a miniscope has been reduced because of rapid open-source development, it is still a bigger device with a higher center of gravity and a greater impact on behavior compared to FP.
7 DATA ACQUISITION
Both FP and miniscope systems have commercial and open-source hardware and software for data acquisition, each with advantages and disadvantages. The main challenge in data acquisition for calcium data revolves around maintaining the same field-of-view over multiple days of recording.
Regarding hardware cost, there are two big manufacturers of photometry setups which are widely adopted: Doric and Tucker-Davis Technologies. These off-the-shelf photometry systems may cost around 10,000-20,000 dollars, but recent open-source alternatives are currently available for optical components (Simone et al., 2018), the acquisition interface and GUI (Akam & Walton, 2019; Owen & Kreitzer, 2019), resulting in a photometry system which costs about one-tenth of the price of traditional systems (Owen & Kreitzer, 2019).
On the other hand, the miniscope community is intensely driven by open source contributions, which rapidly accelerates the development of new technology and design. Since the original 1P miniscope (Ghosh et al., 2011), several one-photon miniscopes systems were developed and became available to the scientific community: the NiNscope has a built-in optogenetic driver and accelerometer, the FinchScope is optimized for birds as a model species and it has a microphone to correlate vocalization with neuronal activity, the Inscopix nVista V4 has a sophisticated focusing system, such that different z-planes can be interweaved acquired very rapidly (full review available from Aharoni & Hoogland, 2019). Although off-the-shelf proprietary systems such as the Inscopix scope are priced at around 70,000 dollars, open-source alternatives such as the UCLA miniscope allow the construction of a system for about 1,500 dollars.
It is critical to record the same neuronal population over multiple days to be able to accurately interpret the output. Because miniscopes have cellular visualization, one can adjust the focus ring from to maintain the same plane of acquisition. This is impossible for FP because it lacks cellular resolution. Moreover, the cable can occasionally slip from the animal’s head during FP recordings with detachable cables, resulting in the recording of a smaller subset of the tagged population over the session. This can be partially remedied by using a low-loss coupling interconnect (such as the ADAL3 from ThorLabs) between the implanted fiber and cable.
During the recording session, for both FP and miniscopes, it is necessary to always have an experimenter attentive to changes in the fluorescence signal and to take note of any anomalies that might occur (e.g. animals damaging the cable). Failure to do so might lead to improperly annotated data and could lead to incorrect conclusions, e.g. decrease in fluorescence being incorrectly ascribed to changes in behavior. To minimize the chances of cable damage, a rotary joint can be used to minimize torque forces on the cable. Another promising technology to eliminate the issue of cable damage is the development of wireless photometry (Khiarak et al., 2018) or wireless miniscope systems (Barbera et al., 2019).
To summarize, both FP and miniscope require thorough consideration in the steps of data acquisition to ensure that the same population is recorded over multiple days. This problem more easily dealt with in miniscopes, by manual or electronically focusing, but it can also be minimized with hardware changes in FP systems, mainly low-loss connectors.
8 DATA ANALYSIS
FP and miniscope have significantly different analysis pipelines, owing to the greater complexity of miniscope data compared to FP data. In order to properly interpret the results, it is important to understand the core ideas of each analysis pipeline as well as limitations intrinsic to each method and associated behavioral task.
8.1 PHOTOMETRY DATA ANALYSIS
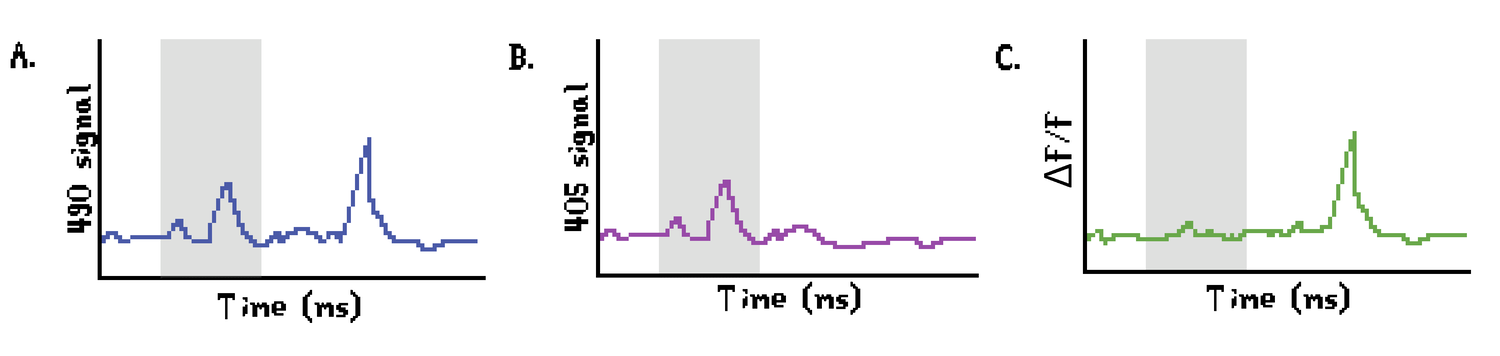
In terms of data complexity, FP data constitutes a simple database that stores incoming fluorescence in a one-dimensional time series (often 100-200 MB/hour). Photometry data analysis consists of two main steps: motion correction and correlation with behavior. Movement artifacts can be resolved in two ways. One option is to use time-correlated single-photon counting, which uses rapid oscillation of the excitation light and uses post-hoc analysis to isolate the fluorescence signal (Gunaydin et al., 2014). Another option is to make use of two excitation lights, a blue light to excite GCaMP and a purple light, which is GCaMP-insensitive and serves as a control channel (Zalocusky et al., 2016, Figure 6). With this system, the ΔF/F is calculated with a straightforward formula: ΔF/F = (Signal(490nm) – Signal(405nm))/ Signal(405nm)
The ΔF/F signal is then usually aligned with behavioral performance, such as lever presses, nose pokes, and food magazine entries. The experimenter often chooses a time window which is representative of the brain function they would like to assess, for instance, during the preparatory attention phase in a choice paradigm to indicate impulse control or before a lever press to assess motor planning. Many parameters can be used to compare ΔF/F traces, ranging from area under the curve and maximum peak amplitude calculations, to inferences of spikes from deviations of baseline activity.
Although the data acquired from the photometry setup is relatively simple, the interpretation can still be challenging. Even though movement artifacts can be corrected with a ΔF/F calculation, there is still a general effect of movement which is difficult to account for, since the execution of movement results in a brain-wide increase of activity (Musall et al., 2019) even in sensory areas (Parker et al., 2020). Because the animal is freely moving, exact behavior and movement will vary on a trial-to-trial basis, which means that even when selecting the same time windows around task events, one might find differences in fluorescence signal – not because there is a change in cognitive function, but because there is a difference in how much the animal is moving at these time points. In the context of mPFC studies, this is known as the ‘Euston-Cowen-McNaughton Hassle’ (Powell & Redish, 2016), the observation that differences in brain activity can be explained by differences in movement at different trial periods. It is worth noting that this effect of movement in brain activity is also present in miniscope data, although the spatial information allows for the general separation of ‘movement-related’ and ‘movement-unrelated’ neurons (da Silva, 2018), which is not possible for FP data.
8.2 MINISCOPE DATA ANALYSIS
Compared to the one-dimensional time series data collected from fiber photometry, miniscope data is multidimensional and present several challenges. First, miniscope data is acquired in a video format and data acquisition can come up to 100 GB/hour (Pnevmatikakis, 2019), which means that miniscope data analysis requires significantly better hardware and IT infrastructure for storage and retrieval of potentially multiple terabytes of data for each experiment. Second, the steps of registration, source separation, and deconvolution need to be high-throughput due to the large data size.
8.2.1 REGISTRATION
Because the brain is a soft organ, it moves and deforms as the animal is moving, and neurons in the field-of-view move in a non-rigid fashion over time, i.e. some neurons might move in different directions while others stay in place. Therefore, a straightforward rigid movement correction, i.e. moving the entire frame by x pixels, is not adequate for miniscope datasets, because they result in neurons being in different locations in the field-of-view over time. A solution is a non-rigid form of registration, which takes into account the brain deformation, for instance, by modeling topological features of elastic bodies and inferring the underlying motion (Ahmad & Khan, 2015) or utilizing probabilistic methods to track the same neurons in different positions across time (Sheintuch et al., 2017). These non-rigid solutions require significantly more computational power compared to rigid registration methods.
The most commonly used method for image registration of miniscope data is the NoRMCorre algorithm (Pnevmatikakis & Giovannucci, 2017), which uses rigid registration to arrive at non-rigid results. To accomplish that, the algorithm subdivides the video input into a grid of overlapping sections (Figure 7). It then applies a rigid motion correction to every single section of the video (e.g. move the entire section upward x pixels). The smaller the sections, the better the approximation to a proper non-linear registration it will be. The entire frame is then reconstructed by stitching the overlapping portions of these segments. Instead of repeating the process de novo for every frame, a template frame is stored, and every subsequent frame is calculated in reference to the template to optimize processing time.

8.2.2 SOURCE SEPARATION
With a stabilized video, the next challenge is to separate every neuron in the frame. This is computationally challenging because of the size of video files. It is also worth noting that one-photon imaging captures a lot of neuronal sources outside the plane of focus, which must be accounted for in the analysis. Furthermore, background noise essentially changes every frame in one-photon data.
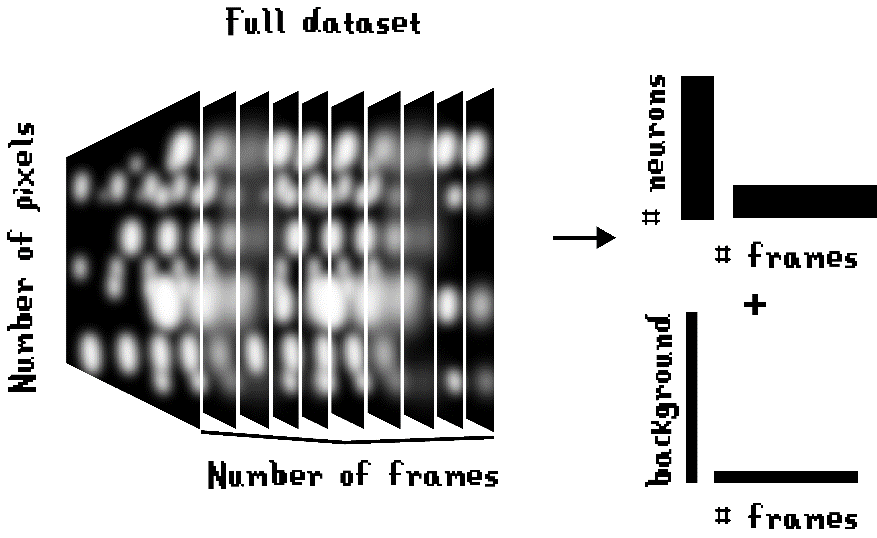
The most widely used algorithm for source separation of one-photon miniscope data is CNMF-E (Zhou et al., 2018). This algorithm does not store all the information from every pixel in every frame of the video. Instead, it only captures the information from the fluorescence sources in the field-of-view and an average of the background fluorescence, allowing for a great compression of data size (Figure 8). Once the video information is unveiled into separate components, it is possible to use a memory infrastructure that allows parallel processing, making use of multiple CPU cores to optimize processing time.
A problem that needs to be addressed by the source separation algorithm is the fact that there are overlapping neurons in three-dimensional space that occupy the same pixels in the x-y field of view. This is usually not taken into account when source separation is performed with simpler methods such as manual region-of-interest annotation or PCA/ICA methods (Zhang et al., 2019). CNMF-E can separate neurons with a great overlap in the field of view, distinguishing the different sources by their different periods of activity.
A quality check for the soma shape is required after the putative neurons have been identified and separated. This task can be performed manually or with the assistance of machine learning methods. The use of unbiased machine learning methods is important because even among expert annotators there can be a disagreement level of 20% (Pnevmatikakis, 2019).
8.2.3 DECONVOLUTION
The resulting fluorescence signal depends on the sensitivity and kinetics of the GCaMP isoform used. Therefore, after source separation, the fluorescence signal needs to be deconvolved into spike activity. Importantly, prior to deconvolution, the data needs to be detrended to remove the influences of photobleaching throughout the recording. A common deconvolution method is the OASIS algorithm (Friedrich, Zhou, & Paninski, 2017), which has been benchmarked as superior against nine other deconvolution methods (Berens et al., 2017).
8.2.4 COMPARISON OF OPEN-SOURCE PACKAGES
To facilitate the workflow of the several steps required for miniscope data analysis, several open-source packages compile the required tools for registration, source separation, and deconvolution, including CaImAn (Giovannucci et al., 2019) EZCalcium (Cantu et al., 2020), MiniscopeAnalysis and its subsequent implementation of PIMPN (Etter, Manseau, & Williams, 2020), MIN1PIPE (J. Lu et al., 2018) and CAVE (Tegtmeier et al., 2018) (Table 1).
Table 1. Overview of commonly used miniscope analysis packages.

To summarize, FP and miniscope differ enormously in their data analysis pipelines. FP data is significantly simpler and allows for more straightforward analysis steps, whereas the spatial information of miniscope data poses several technical challenges that need to be tackled with more sophisticated algorithms. Data interpretation needs to be contextualized in terms of the behavioral task the animals are performing and how well the experimental design controls for the effects of movement in brain activity.
9 CHALLENGES IN DATA INTERPRETATION
The miniscope has one great advantage over photometry systems: cellular resolution. However, this considerable advantage comes with several complications: the necessity of a larger implant in the brain to gather sufficient light, a bigger device that interferes more intensely with the vestibular system of the animal, and many technical challenges in data acquisition and data analysis. In this context, there is a crucial question that needs to be addressed: Why is cellular resolution worth these many disadvantages in the first place?
Consider a hypothetical scenario with a total population of three neurons. In the first scenario, each neuron fires once, one after the other (Figure 9A), whereas in the second scenario, the same neuron fires three times (Figure 9B). While this would be easily distinguishable with a miniscope, it would yield the same signal in photometry data – even though the biological meaning of each situation is radically different.
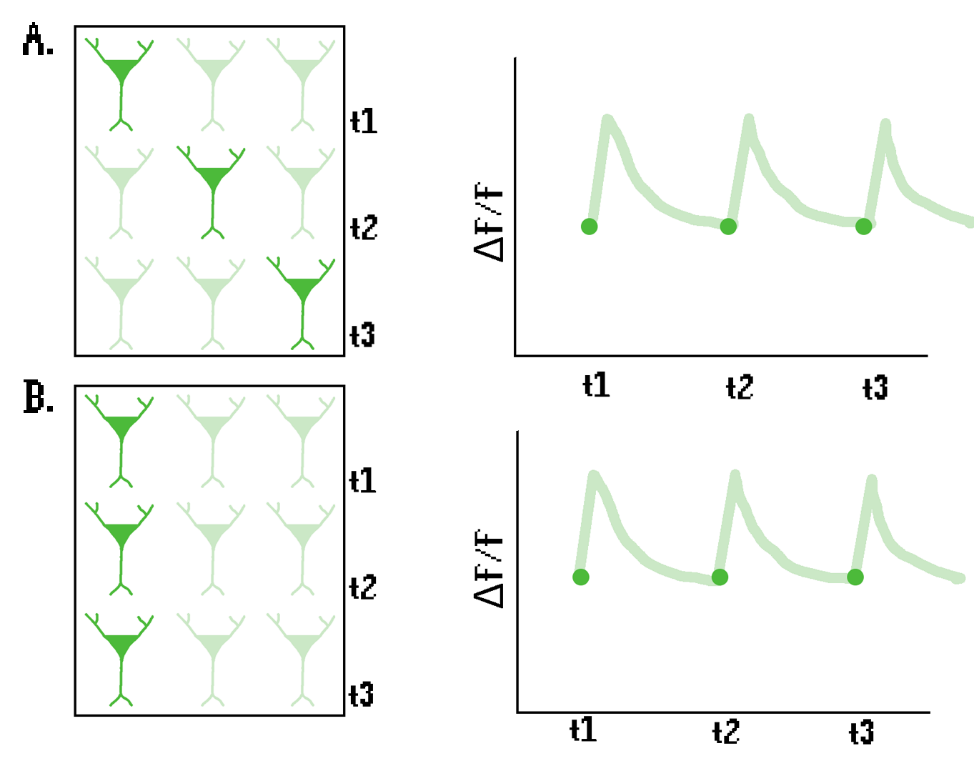
This example illustrates the main limitation of FP: it collapses all spatial information into a single dimension, so there is no way to differentiate the activity of different subsets of a neuronal population at different time points. For instance, miniscope studies have shown that different mPFC ensembles are active during distinct social behavior tests (Liang et al., 2018). It is conceivable that similarly sized neuronal ensembles would yield similar patterns of activity in FP data, possibly leading to erroneous interpretations of the results.
However, photometry data can be informative to characterize synchronous activity of a genetically separable population in a well-defined behavioral paradigm. When these conditions are met, FP has been shown to yield informative links between brain activity and behavior: examples include 1) understanding how the activity of CRH neurons in the paraventricular nucleus influence escape behavior (Daviu et al., 2020); 2) explaining the differences in activity between GABAergic and serotonergic neurons in the dorsal raphe nucleus that promote or inhibit movement in terms of threat potential (Seo et al., 2019); 3) unveiling the dynamics of hypothalamic neuronal subtypes that drive feeding behavior (Chen et al., 2015).
In contrast, miniscope data is multidimensional, allowing for studies where ensemble activity can be observed over time. The spatial information of neurons is important for experimental questions regarding asynchronous populations, when there is no clear genetic marker that separates different populations and when the behavior is more naturalistic and has more degrees of freedom. Examples include 1) unveiling the activity of heterogeneous ensembles of the habenula during escape behavior (Lecca et al., 2020), 2) assessing the complex dynamics hippocampal cell firing in epileptic mice (Shuman et al., 2020) and 3) understanding the relationship of how changes in the maturation of hippocampal ensembles to the consolidation of a fear memory (Kitamura et al., 2017).
To summarize, no technique is necessarily better for any given behavioral task – illustrated by fleeing behavior studies with FP or miniscope (Daviu et al., 2020; Lecca et al., 2020) – or brain region – illustrated by the fact that the dorsal medial striatum has been studied with both techniques (Barbera et al., 2016; Kupferschmidt et al., 2017). In general, photometry is appropriate for genetically separable and synchronous neuronal populations while the miniscope can be used for more nuanced questions, allowing the study of genetically inseparable and asynchronous ensembles.
10 FUTURE OF CALCIUM IMAGING RESEARCH
While it is important to consider the limitations of FP and miniscopes to properly interpret the data from these Behavioral Neuroscience studies, it is worth to scan the horizon for future developments in the field that could overcome some of the current shortcomings.
10.1 BETTER OPTIC PROBES
As previously described (See Section 2), GCaMP is an indirect indicator of neuronal activity which may lead to confounding results when syncing fluorescence data to behavior, especially for molecules with slower kinetics (Sabatini, 2019). An alternative to calcium probes is the use of voltage indicators, which have a better temporal resolution (Resendez et al., 2016), while also avoiding problems with buffering of intracellular calcium. They have seen limited use in neuroscientific research due to a poor signal to noise ratio, but the development of brighter voltage indicators could answer a range of new biological questions (Song, Barnes & Knöpfel., 2017). Currently, FP is more appropriate for indicators with a poor signal-to-noise ratio (L. Li et al., 2017) because of its higher sensitivity of detection compared to the miniscope sensor.
A future alternative to the use of GCaMP could be the utilization of bioluminescent molecules as a calcium indicator (e.g. luciferase bound with calmodulin). Because these molecules do not require excitation light, confounding problems of phototoxicity are avoided, while also reducing the number of parts in a miniscope – without an excitation light, a UCLA miniscope would be 22% lighter and 58% less expensive (Celinskis et al., 2020).
10.2 ENGRAM-SPECIFIC TAGGING
Expressing a calcium indicator in a specific subset of neurons may give insight into whether certain projections or cell-types are active during a behavioral task. However, this tagging strategy also includes neurons unrelated to the behavior being studied (Josselyn & Tonegawa, 2020). This can confound interpretation since no systematic analysis can be done post-hoc to assess which neurons were related to the task. These confounding factors are even more problematic when analyzing associative cortices such as the mPFC, in which any given neuron may have motoric, limbic, or sensory inputs (Heidbreder & Groenewegen, 2003). An interesting technique to reduce this problem is the use of viral-based TRAP (targeted recombination in active populations) to express GCaMP only in the neurons which were naturally active during the task (Matos et al., 2019). Especially for miniscope studies, the utilization of Fos-Cre-GCaMP systems (Ivashkina et al., 2019) to assess long-term changes only in neurons that are related to a task holds a lot of promise for specifically associating shifts in neuronal activity to changes in behavior.
10.3 MULTIPLE-PHOTON MINISCOPES
Despite substantial technical challenges of two-photon miniscopes, recent models have allowed solutions for high-temporal resolution and low motion-artifacts in a light-weight, 2 g apparatus, allowing visualization of soma, dendrites, and axons (Zong et al., 2017). In addition, 3-photon microscopy (which uses wavelengths in the order of 1300 nm) allows the visualization of neurons in the hippocampus 1 mm below the cortical surface (Ouzounov et al., 2017). While the development of multiple-photon microscopy is currently hampered by technical challenges and expensive setups, the technology of using increasingly longer wavelengths holds promise in terms of tissue penetrance and could potentially allow the study of subcortical regions without the necessity of a GRIN lens implant.
10.4 SIMULTANEOUS CALCIUM IMAGING AND VIDEO ANALYSIS
Advances in Behavioral Neuroscience will include the association between neuronal activity and granular annotation of the animal’s behavior from video data analysis. While proprietary software has offered some integration support (e.g. Bonsai and the UCLA miniscope) (Lopes et al., 2015), rapid advances of open-source programs like DeepLabCut (Mathis et al., 2018) will likely be commonplace in a few years. Video analysis software allows researchers to separate of movement-related neuronal activity related to cognitive effects of the task, which allow for a more accurate interpretation of
10.5 REDUCTION OF HUMAN INTERFERENCE
An important consideration for Behavioral Neuroscience is the fact that stress affects brain function (Datta & Arnsten, 2019). Therefore, differences in animal handling between different labs are an important confounding factor and an important part of the current ‘replicability crisis’ (Lonsdorf et al., 2017). One solution is the wide adoption of rigorous and detailed protocols for animal handling, allowing for better comparisons of results and effect sizes across different labs. A technological solution is the removal of human-animal interactions altogether, aided by the development of wireless miniscopes (Barbera et al., 2019) or wireless photometry systems (Lu et al., 2018), especially if these wireless systems could be protected enough such that single-housing was no longer necessary. Another technological advance that will aid in this direction is the development of home cage systems integrated with behavioral paradigms (Bruinsma et al., 2019), notably when these technologies could be combined with an automatic weighing of the animal (Noorshams, Boyd, & Murphy, 2017). This combination of technologies would provide a significant reduction in unsystematic bias between studies, while simultaneously reducing the workload of researchers.
11 CONCLUSION
To conclude, both FP and miniscopes are important techniques for the advance of understanding population dynamics in freely moving animals and future technological advances hold great promise of improvement. The level of analysis at a population level is crucial for advancing the understanding of the brain because complex information is not stored in a single neuron, but rather at a sparse population level in the nervous system (Doetsch, 2000). However, it is important to keep in mind that these methods allow the observation of activity of a few hundred cells, which is only a minuscule percentage of the mouse or rat brain – which have around 70 and 200 million neurons respectively (Herculano-Houzel, Mota & Lent, 2006). The tagged neurons will also invariability contain neurons unrelated to the execution of the behavioral task (Gonzalez et al., 2019) and often contain movement-related increases in brain activity (Musall et al., 2019), leading to confounding effects on the data. Therefore, the interpretation of results acquired with these methods needs to be grounded in a solid understanding of the trade-offs and limitations of each technique.
12 REFERENCES
Aharoni, D., & Hoogland, T. M. (2019, January 29). Circuit investigations with open-source miniaturized microscopes: Past, present and future. Frontiers in Cellular Neuroscience. Frontiers Media S.A. https://doi.org/10.3389/fncel.2019.00141
Ahmad, S., & Khan, M. F. (2015). Topology preserving non-rigid image registration using time-varying elasticity model for MRI brain volumes. Computers in Biology and Medicine, 67, 21–28. https://doi.org/10.1016/j.compbiomed.2015.09.022
Akam, T., & Walton, M. E. (2019). pyPhotometry: Open source Python based hardware and software for fiber photometry data acquisition. Scientific Reports, 9(1). https://doi.org/10.1038/s41598-019-39724-y
Akerboom, J., Chen, T. W., Wardill, T. J., Tian, L., Marvin, J. S., Mutlu, S., … Looger, L. L. (2012). Optimization of a GCaMP calcium indicator for neural activity imaging. Journal of Neuroscience, 32(40), 13819–13840. https://doi.org/10.1523/JNEUROSCI.2601-12.2012
Arosio, D., & Ratto, G. M. (2014). Twenty years of fluorescence imaging of intracellular chloride. Frontiers in Cellular Neuroscience, 8(1), 258. https://doi.org/10.3389/fncel.2014.00258
Augustine, G. J., Charlton, M. P., & Smith, S. J. (1985). Calcium entry and transmitter release at voltage-clamped nerve terminals of squid. J. Physiol, 361, 163–181. Retrieved from https://www.ncbi.nlm.nih.gov/pmc/articles/PMC1193058/pdf/jphysiol00565-0174.pdf
Barbera, G., Liang, B., Zhang, L., Gerfen, C. R., Culurciello, E., Chen, R., … Lin, D. T. (2016). Spatially Compact Neural Clusters in the Dorsal Striatum Encode Locomotion Relevant Information. Neuron, 92(1), 202–213. https://doi.org/10.1016/j.neuron.2016.08.037
Barbera, G., Liang, B., Zhang, L., Li, Y., & Lin, D. T. (2019). A wireless miniScope for deep brain imaging in freely moving mice. Journal of Neuroscience Methods, 323(March), 56–60. https://doi.org/10.1016/j.jneumeth.2019.05.008
Barnett, L. M., Hughes, T. E., & Drobizhev, M. (2017). Deciphering the molecular mechanism responsible for GCaMP6m’s Ca2+-dependent change in fluorescence. PLOS ONE, 12(2), e0170934. https://doi.org/10.1371/journal.pone.0170934
Barnett, L., Platisa, J., Popovic, M., Pieribone, V. A., & Hughes, T. (2012). A Fluorescent, Genetically-Encoded Voltage Probe Capable of Resolving Action Potentials. PLoS ONE, 7(9). https://doi.org/10.1371/journal.pone.0043454
Barretto, R. P. J., Messerschmidt, B., & Schnitzer, M. J. (2009). In vivo fluorescence imaging with high-resolution microlenses. https://doi.org/10.1038/NMETH.1339
Berens, P., Freeman, J., Deneux, T., Chenkov, N., McColgan, T., Speiser, A., … Bethge, M. (2017). Community-based benchmarking improves spike rate inference from two-photon calcium imaging data. Community-Based Benchmarking Improves Spike Rate Inference from Two-Photon Calcium Imaging Data, 16, 177956. https://doi.org/10.1101/177956
Berezin, M. Y., & Achilefu, S. (2010). Fluorescence lifetime measurements and biological imaging. Chemical Reviews, 110(5), 2641–2684. https://doi.org/10.1021/cr900343z
Beyene, A. G., Delevich, K., Yang, S. J., & Landry, M. P. (2018). New Optical Probes Bring Dopamine to Light. Biochemistry, 57(45), 6379–6381. https://doi.org/10.1021/acs.biochem.8b00883
Bollmann, J. H., & Engert, F. (2009). Subcellular Topography of Visually Driven Dendritic Activity in the Vertebrate Visual System. Neuron, 61(6), 895–905. https://doi.org/10.1016/j.neuron.2009.01.018
Bolon, B., & Butt, M. T. (2011). Fundamental Neuropathology for Pathologists and Toxicologists: Principles and Techniques. John Wiley and Sons. https://doi.org/10.1002/9780470939956
Bruinsma, B., Terra, H., de Kloet, S. F., Luchicchi, A., Timmerman, A. J., Remmelink, E., … Mansvelder, H. D. (2019). An automated home-cage-based 5-choice serial reaction time task for rapid assessment of attention and impulsivity in rats. Psychopharmacology, 1–12. https://doi.org/10.1007/s00213-019-05189-0
Campos, P. (2019). Diving into the brain: deep brain imaging techniques in conscious animals. Endocrine Abstracts, 1–35. https://doi.org/10.1530/endoabs.63.nsa6
Cantu, D. A., Wang, B., Gongwer, M. W., He, C. X., Goel, A., Suresh, A., … Portera-Cailliau, C. (2020). EZcalcium: Open-Source Toolbox for Analysis of Calcium Imaging Data. Frontiers in Neural Circuits, 14. https://doi.org/10.3389/fncir.2020.00025
Celinskis, D., Friedman, N., Koksharov, M., Murphy, J., Gomez-ramirez, M., Borton, D., … Moore, C. (2020). Miniaturized Devices for Bioluminescence Imaging in Freely Behaving Animals. BioRxiv.
Chen, T. W., Wardill, T. J., Sun, Y., Pulver, S. R., Renninger, S. L., Baohan, A., … Kim, D. S. (2013). Ultrasensitive fluorescent proteins for imaging neuronal activity. Nature, 499(7458), 295–300. https://doi.org/10.1038/nature12354
Chen, Y., Lin, Y. C., Kuo, T. W., & Knight, Z. A. (2015). Sensory Detection of Food Rapidly Modulates Arcuate Feeding Circuits. Cell, 160(5), 829–841. https://doi.org/10.1016/j.cell.2015.01.033
Cobbold, P. H., & Rink, T. J. (1987). Fluorescence and bioluminescence measurement of cytoplasmic free calcium. Biochemical Journal. Biochem J. https://doi.org/10.1042/bj2480313
Da Silva, J. A., Tecuapetla, F., Paixão, V., & Costa, R. M. (2018). Dopamine neuron activity before action initiation gates and invigorates future movements. Nature, 554(7691), 244–248. https://doi.org/10.1038/nature25457
Dana, H., Sun, Y., Mohar, B., Hulse, B. K., Kerlin, A. M., Hasseman, J. P., … Kim, D. S. (2019). High-performance calcium sensors for imaging activity in neuronal populations and microcompartments. Nature Methods, 16(7), 649–657. https://doi.org/10.1038/s41592-019-0435-6
Datta, D., & Arnsten, A. F. T. (2019). Loss of prefrontal cortical higher cognition with uncontrollable stress: Molecular mechanisms, changes with age, and relevance to treatment. Brain Sciences, 9(5), 1–16. https://doi.org/10.3390/brainsci9050113
Daviu, N., Füzesi, T., Rosenegger, D. G., Rasiah, N. P., Sterley, T. L., Peringod, G., & Bains, J. S. (2020). Paraventricular nucleus CRH neurons encode stress controllability and regulate defensive behavior selection. Nature Neuroscience, 23(3), 398–410. https://doi.org/10.1038/s41593-020-0591-0
de Groot, A., van den Boom, B. J. G., van Genderen, R. M., Coppens, J., van Veldhuijzen, J., Bos, J., … Hoogland, T. M. (2020). Ninscope, a versatile miniscope for multi-region circuit investigations. ELife, 9, 1–24. https://doi.org/10.7554/eLife.49987
Doetsch, G. S. (2000). Patterns in the brain: Neuronal population coding in the somatosensory system. Physiology and Behavior, 69(1), 187–201. https://doi.org/10.1016/S0031-9384(00)00201-8
Etter, G., Manseau, F., & Williams, S. (2020). A Probabilistic Framework for Decoding Behavior From in vivo Calcium Imaging Data. Frontiers in Neural Circuits, 14(May), 1–16. https://doi.org/10.3389/fncir.2020.00019
Farhana, I., Hossain, N., Suzuki, K., Matsuda, T., & Nagai, T. (2019). Genetically Encoded Fluorescence/Bioluminescence Bimodal Indicators for Ca 2+ Imaging. https://doi.org/10.1021/acssensors.9b00531
Friedrich, J., Zhou, P., & Paninski, L. (2017). Fast online deconvolution of calcium imaging data. PLoS Computational Biology, 13(3). https://doi.org/10.1371/journal.pcbi.1005423
Ghosh, K. K., Burns, L. D., Cocker, E. D., Nimmerjahn, A., Ziv, Y., Gamal, A. El, & Schnitzer, M. J. (2011). Miniaturized integration of a fluorescence microscope. Articles Nsture Methods, 8(10). https://doi.org/10.1038/Nmeth.1694
Giovannucci, A., Friedrich, J., Gunn, P., Kalfon, J., Brown, B. L., Koay, S. A., … Pnevmatikakis, E. A. (2019). CaImAn an open source tool for scalable calcium imaging data analysis. ELife, 8. https://doi.org/10.7554/eLife.38173
Girven, K. S., & Sparta, D. R. (2017). Probing Deep Brain Circuitry: New Advances in in Vivo Calcium Measurement Strategies. ACS Chemical Neuroscience. https://doi.org/10.1021/acschemneuro.6b00307
Glas, A., Hübener, M., Bonhoeffer, T., & Goltstein, P. M. (2019). Benchmarking miniaturized microscopy against two-photon calcium imaging using single-cell orientation tuning in mouse visual cortex. PLoS ONE, 14(4). https://doi.org/10.1371/journal.pone.0214954
Gonzalez, W., Zhang, H., Harutyunyan, A., & Lois, C. (2019). Persistence of neuronal representations through time and damage in the hippocampus. Science, 559104. https://doi.org/10.1101/559104
Grienberger, C., & Konnerth, A. (2012, March 8). Imaging Calcium in Neurons. Neuron. Neuron. https://doi.org/10.1016/j.neuron.2012.02.011
Gunaydin, L. A., Grosenick, L., Finkelstein, J. C., Kauvar, I. V., Fenno, L. E., Adhikari, A., … Deisseroth, K. (2014). Natural neural projection dynamics underlying social behavior. Cell, 157(7), 1535–1551. https://doi.org/10.1016/j.cell.2014.05.017
Hamel, E. J. O., Grewe, B. F., Parker, J. G., & Schnitzer, M. J. (2015, April 8). Cellular level brain imaging in behaving mammals: An engineering approach. Neuron. Cell Press. https://doi.org/10.1016/j.neuron.2015.03.055
Helmchen, F. (2009). Two-Photon Functional Imaging of Neuronal Activity (pp. 37–58). CRC Press/Taylor & Francis. https://doi.org/10.1201/9781420076851.ch2
Helmchen, F., Fee, M. S., Tank, D. W., & Denk, W. (2001). A miniature head-mounted two-photon microscope: High-resolution brain imaging in freely moving animals. Neuron, 31(6), 903–912. https://doi.org/10.1016/S0896-6273(01)00421-4
Herculano-Houzel, S., Mota, B., & Lent, R. (2006). Cellular scaling rules for rodent brains. Retrieved from www.pnas.orgcgidoi10.1073pnas.0604911103
Heidbreder, C. A., & Groenewegen, H. J. (2003). The medial prefrontal cortex in the rat: Evidence for a dorso-ventral distinction based upon functional and anatomical characteristics. Neuroscience and Biobehavioral Reviews, 27(6), 555–579. https://doi.org/10.1016/j.neubiorev.2003.09.003
Hohlbaum, K., Bert, B., Dietze, S., Palme, R., Fink, H., & Thöne-Reineke, C. (2017). Severity classification of repeated isoflurane anesthesia in C57BL/6JRj mice – Assessing the degree of distress. PLoS ONE, 12(6). https://doi.org/10.1371/journal.pone.0179588
Inoue, M., Takeuchi, A., Manita, S., Horigane, S. ichiro, Sakamoto, M., Kawakami, R., … Bito, H. (2019). Rational Engineering of XCaMPs, a Multicolor GECI Suite for In Vivo Imaging of Complex Brain Circuit Dynamics. Cell, 177(5), 1346-1360.e24. https://doi.org/10.1016/j.cell.2019.04.007
Ivashkina, O. I., Gruzdeva, A. M., Roshchina, M. A., Toropova, K. A., & Anokhin, K. V. (2019). Ex vivo and in vivo imaging of mouse parietal association cortex activity in episodes of cued fear memory formation and retrieval. BioRxiv, 863589. https://doi.org/10.1101/863589
Josselyn, S. A., & Tonegawa, S. (2020). Memory engrams: Recalling the past and imagining the future. Science, 367(6473). https://doi.org/10.1126/science.aaw4325
Jun, J. J., Steinmetz, N. A., Siegle, J. H., Denman, D. J., Bauza, M., Barbarits, B., … Harris, T. D. (2017). Fully integrated silicon probes for high-density recording of neural activity. Nature, 551(7679), 232–236. https://doi.org/10.1038/nature24636
Khiarak, M. N., Martianova, E., Bories, C., Martel, S., Proulx, C. D., De Koninck, Y., & Gosselin, B. (2018). A Wireless Fiber Photometry System Based on a High-Precision CMOS Biosensor with Embedded Continuous-Time Σ Δ Modulation. IEEE Transactions on Biomedical Circuits and Systems, 12(3), 495–509. https://doi.org/10.1109/TBCAS.2018.2817200
Kim, C. K., Yang, S. J., Pichamoorthy, N., Young, N. P., Kauvar, I., Jennings, J. H., … Deisseroth, K. (2016). simultaneous fast measurement of circuit dynamics at multiple sites across the mammalian brain, 13(4), 325. https://doi.org/10.1038/Nmeth.3770
Kitamura, T., Ogawa, S. K., Roy, D. S., Okuyama, T., Morrissey, M. D., Smith, L. M., … Tonegawa, S. (2017). Engrams and circuits crucial for systems consolidation of a memory. Science, 356(6333), 73–78. https://doi.org/10.1126/science.aam6808
Krohn, T. C., Sørensen, D. B., Ottesen, J. L., & & Hansen, A. K. (2006). The effects of individual housing on mice and rats: A review. Retrieved May 29, 2020, from https://psycnet.apa.org/record/2008-10455-001
Kupferschmidt, D. A., Juczewski, K., Cui, G., Johnson, K. A., & Lovinger, D. M. (2017). Parallel, but Dissociable, Processing in Discrete Corticostriatal Inputs Encodes Skill Learning. Neuron, 96(2), 476-489.e5. https://doi.org/10.1016/j.neuron.2017.09.040
Lecca, S., Namboodiri, V. M. K., Restivo, L., Gervasi, N., Pillolla, G., Stuber, G. D., & Mameli, M. (2020). Heterogeneous Habenular Neuronal Ensembles during Selection of Defensive Behaviors. Cell Reports, 31(10). https://doi.org/10.1016/j.celrep.2020.107752
Li, L., Tang, Y., Sun, L., Rahman, K., Huang, K., Xu, W., … Cao, G. (2017). In vivo fiber photometry of neural activity in response to optogenetically manipulated inputs in freely moving mice. Journal of Innovative Optical Health Sciences, 10(5). https://doi.org/10.1142/S1793545817430015
Li, Y., Liu, Z., Guo, Q., & Luo, M. (2019). Long-term Fiber Photometry for Neuroscience Studies. Neuroscience Bulletin, 35(3), 425–433. https://doi.org/10.1007/s12264-019-00379-4
Liang, B., Zhang, L., Barbera, G., Chen, R., Li, Y., & Lin, D.-T. (2018). Distinct and Dynamic ON and OFF Neural Ensembles in the Prefrontal Cortex Code Social Exploration. Neuron, 100, 700-714.e9. https://doi.org/10.1016/j.neuron.2018.08.043
Lonsdorf, T. B., Menz, M. M., Andreatta, M., Fullana, M. A., Golkar, A., Haaker, J., … Merz, C. J. (2017). Don’t fear ‘fear conditioning’: Methodological considerations for the design and analysis of studies on human fear acquisition, extinction, and return of fear. Neuroscience and Biobehavioral Reviews, 77, 247–285. https://doi.org/10.1016/j.neubiorev.2017.02.026
Lopes, G., Bonacchi, N., Frazão, J., Neto, J. P., Atallah, B. V., Soares, S., … Kampff, A. R. (2015). Bonsai: an event-based framework for processing and controlling data streams. Frontiers in Neuroinformatics, 9(APR), 7. https://doi.org/10.3389/fninf.2015.00007
Lu, J., Li, C., Singh-Alvarado, J., Zhou, C., Frö, F., Mooney, R., & Wang, F. (2018). MIN1PIPE: A Miniscope 1-Photon-Based Calcium Imaging Signal Extraction Pipeline. Cell Reports, 23, 3673–3684. https://doi.org/10.1016/j.celrep.2018.05.062
Lu, L., Gutruf, P., Xia, L., Bhatti, D. L., Wang, X., Vazquez-Guardado, A., … Rogers, J. A. (2018). Wireless optoelectronic photometers for monitoring neuronal dynamics in the deep brain. Proceedings of the National Academy of Sciences of the United States of America, 115(7), E1374–E1383. https://doi.org/10.1073/pnas.1718721115
Ma, Q., Ye, L., Liu, H., Shi, Y., & Zhou, N. (2017, May 4). An overview of Ca2+ mobilization assays in GPCR drug discovery. Expert Opinion on Drug Discovery. Taylor and Francis Ltd. https://doi.org/10.1080/17460441.2017.1303473
Manouze, H., Ghestem, A., Poillerat, V., Bennis, M., Ba-M’hamed, S., Benoliel, J. J., … Bernard, C. (2019). Effects of single cage housing on stress, cognitive, and seizure parameters in the rat and mouse pilocarpine models of epilepsy. ENeuro, 6(4). https://doi.org/10.1523/ENEURO.0179-18.2019
Marvin, J. S., Borghuis, B. G., Tian, L., Cichon, J., Harnett, M. T., Akerboom, J., … Looger, L. L. (2013). An optimized fluorescent probe for visualizing glutamate neurotransmission. Nature Methods, 10(2), 162–170. https://doi.org/10.1038/nmeth.2333
Mathis, A., Mamidanna, P., Cury, K. M., Abe, T., Murthy, V. N., Mathis, M. W., & Bethge, M. (2018). DeepLabCut: markerless pose estimation of user-defined body parts with deep learning. Nature Neuroscience, 21(9), 1281–1289. https://doi.org/10.1038/s41593-018-0209-y
Matos, M. R., Visser, E., Kramvis, I., van der Loo, R. J., Gebuis, T., Zalm, R., … van den Oever, M. C. (2019). Memory strength gates the involvement of a CREB-dependent cortical fear engram in remote memory. Nature Communications, 10(1). https://doi.org/10.1038/s41467-019-10266-1
Musall, S., Kaufman, M. T., Juavinett, A. L., Gluf, S., & Churchland, A. K. (2019). Single-trial neural dynamics are dominated by richly varied movements. Nature Neuroscience, 22(10), 1677–1686. https://doi.org/10.1038/s41593-019-0502-4
Nakai, J., Ohkura, M., & Imoto, K. (2001). A high signal-to-noise ca2+ probe composed of a single green fluorescent protein. Nature Biotechnology, 19(2), 137–141. https://doi.org/10.1038/84397
Nicolelis, M. (2011). Beyond boundaries : the new neuroscience of connecting brains with machines–and how it will change our lives (1st ed.). New York: Times Books/Henry Holt and Co.
Nicolelis, M. A. L., Ghazanfar, A. A., Stambaugh, C. R., Oliveira, L. M. O., Laubach, M., Chapin, J. K., … Kaas, J. H. (1998). Simultaneous encoding of tactile information by three primate cortical areas. Nature Neuroscience, 1(7), 621–630. https://doi.org/10.1038/2855
Noorshams, O., Boyd, J. D., & Murphy, T. H. (2017). Automating mouse weighing in group homecages with Raspberry Pi micro-computers. Journal of Neuroscience Methods, 285, 1–5. https://doi.org/10.1016/j.jneumeth.2017.05.002
Oh, J., Lee, C., & Kaang, B. K. (2019, July 1). Imaging and analysis of genetically encoded calcium indicators linking neural circuits and behaviors. Korean Journal of Physiology and Pharmacology. Korean Physiological Soc. and Korean Soc. of Pharmacology. https://doi.org/10.4196/kjpp.2019.23.4.237
Ouzounov, D. G., Wang, T., Wang, M., Feng, D. D., Horton, N. G., Cruz-Hernández, J. C., … Xu, C. (2017). In vivo three-photon imaging of activity of GcamP6-labeled neurons deep in intact mouse brain. Nature Methods, 14(4), 388–390. https://doi.org/10.1038/nmeth.4183
Owen, S. F., & Kreitzer, A. C. (2019). An open-source control system for in vivo fluorescence measurements from deep-brain structures. Journal of Neuroscience Methods, 311, 170–177. https://doi.org/10.1016/j.jneumeth.2018.10.022
Parker, P. R. L., Brown, M. A., Smear, M. C., & Niell, C. M. (2020). Movement-Related Signals in Sensory Areas: Roles in Natural Behavior. Trends in Neurosciences, 1–15. https://doi.org/10.1016/j.tins.2020.05.005
Pisanello, M., Pisano, F., Hyun, M., Maglie, E., Balena, A., De Vittorio, M., … Pisanello, F. (2018). Analytical and empirical measurement of fiber photometry signal volume in brain tissue, i, 1–41. Retrieved from http://arxiv.org/abs/1807.03023
Pisano, F., Pisanello, M., Lee, S. J., Lee, J., Maglie, E., Balena, A., … Pisanello, F. (2019). Depth-resolved fiber photometry with a single tapered optical fiber implant. Nature Methods, 16(11), 1185–1192. https://doi.org/10.1038/s41592-019-0581-x
Pnevmatikakis, E. A. (2019). Analysis pipelines for calcium imaging data. Current Opinion in Neurobiology, 55, 15–21. https://doi.org/10.1016/j.conb.2018.11.004
Pnevmatikakis, E. A., & Giovannucci, A. (2017). NoRMCorre: An online algorithm for piecewise rigid motion correction of calcium imaging data. Journal of Neuroscience Methods, 291, 83–94. https://doi.org/10.1016/j.jneumeth.2017.07.031
Powell, N. J., & Redish, A. D. (2016). Representational changes of latent strategies in rat medial prefrontal cortex precede changes in behaviour. Nature Communications, 7. https://doi.org/10.1038/ncomms12830
Resendez, S. L., Jennings, J. H., Ung, R. L., Namboodiri, V. M. K., Zhou, Z. C., Otis, J. M., … Stuber, G. D. (2016). Visualization of cortical, subcortical and deep brain neural circuit dynamics during naturalistic mammalian behavior with head-mounted microscopes and chronically implanted lenses. Nature Protocols, 11(3), 566–597. https://doi.org/10.1038/nprot.2016.021
Resendez, S. L., & Stuber, G. D. (2015). In Vivo Calcium Imaging to Illuminate Neurocircuit Activity Dynamics Underlying Naturalistic Behavior. Neuropsychopharmacology 2015 40:1, 40(1), 238–239. https://doi.org/10.1038/npp.2014.206
Ross, W. N. (1989). Changes in intracelluar calcium during neuron activity. Annu. Rev. Physiol., (51), 491–506. Retrieved from www.annualreviews.org
Sabatini, B. L. (2019). The impact of reporter kinetics on the interpretation of data gathered with fluorescent reporters. BioRxiv. https://doi.org/10.1017/CBO9781107415324.004
Scanziani, M., & Häusser, M. (2009, October 15). Electrophysiology in the age of light. Nature. Nature Publishing Group. https://doi.org/10.1038/nature08540
Seo, C., Guru, A., Jin, M., Ito, B., Sleezer, B. J., Ho, Y.-Y., … Warden, M. R. (2019). Intense threat switches dorsal raphe serotonin neurons to a paradoxical operational mode Downloaded from. Science (Vol. 363). Retrieved from http://science.sciencemag.org/
Sheintuch, L., Rubin, A., Brande-Eilat, N., Geva, N., Sadeh, N., Pinchasof, O., & Ziv, Y. (2017). Tracking the Same Neurons across Multiple Days in Ca2+ Imaging Data. Cell Reports, 21(4), 1102–1115. https://doi.org/10.1016/j.celrep.2017.10.013
Shuman, T., Aharoni, D., Cai, D. J., Lee, C. R., Chavlis, S., Page-Harley, L., … Golshani, P. (2020). Breakdown of spatial coding and interneuron synchronization in epileptic mice. Nature Neuroscience, 23(2), 229–238. https://doi.org/10.1038/s41593-019-0559-0
Silva, A. J. (2017). Miniaturized two-photon microscope: Seeing clearer and deeper into the brain. Light: Science and Applications, 6(8). https://doi.org/10.1038/lsa.2017.104
Simone, K., Füzesi, T., Rosenegger, D., Bains, J., & Murari, K. (2018). Open-source, cost-effective system for low-light in vivo fiber photometry. Neurophotonics, 5(02), 1. https://doi.org/10.1117/1.nph.5.2.025006
Song, C., Barnes, S., & Knöpfel, T. (2017). Mammalian cortical voltage imaging using genetically encoded voltage indicators: a review honoring professor Amiram Grinvald. Neurophotonics, 4(3), 031214. https://doi.org/10.1117/1.nph.4.3.031214
Steinmetz, N. A., Buetfering, C., Lecoq, J., Lee, C. R., Peters, A. J., Jacobs, E. A. K., … Harris, K. D. (2017). Aberrant cortical activity in multiple GCaMP6-expressing transgenic mouse lines. ENeuro, 4(5). https://doi.org/10.1523/ENEURO.0207-17.2017
Sych, Y., Chernysheva, M., Sumanovski, L. T., & Helmchen, F. (2019). High-density multi-fiber photometry for studying large-scale brain circuit dynamics. Nature Methods, 16(6), 553–560. https://doi.org/10.1038/s41592-019-0400-4
Tegtmeier, J., Brosch, M., Janitzky, K., Heinze, H.-J., Ohl, F. W., & Lippert, M. T. (2018). CAVE: An Open-Source Tool for Combined Analysis of Head-Mounted Calcium Imaging and Behavior in MATLAB. Frontiers in Neuroscience, 12, 958. https://doi.org/10.3389/fnins.2018.00958
Tian, L., Hires, S. A., Mao, T., Huber, D., Chiappe, M. E., Chalasani, S. H., … Looger, L. L. (2009). Imaging neural activity in worms, flies and mice with improved GCaMP calcium indicators. Nature Methods, 6(12), 875–881. https://doi.org/10.1038/nmeth.1398
Wu, L., Zhao, H., Weng, H., & Ma, D. (2019, April 19). Lasting effects of general anesthetics on the brain in the young and elderly: “mixed picture” of neurotoxicity, neuroprotection and cognitive impairment. Journal of Anesthesia. Springer Tokyo. https://doi.org/10.1007/s00540-019-02623-7
Yang, L., Zhao, Y., Wang, Y., Liu, L., Zhang, X., Li, B., & Cui, R. (2015). The Effects of Psychological Stress on Depression. Current Neuropharmacology, 13(4), 494–504. https://doi.org/10.2174/1570159X1304150831150507
Yang, Y., Liu, N., He, Y., Liu, Y., Ge, L., Zou, L., … Liu, X. (2018). Improved calcium sensor GCaMP-X overcomes the calcium channel perturbations induced by the calmodulin in GCaMP. Nature Communications, 9(1). https://doi.org/10.1038/s41467-018-03719-6
Zalocusky, K. A., Ramakrishnan, C., Lerner, T. N., Davidson, T. J., Knutson, B., & Deisseroth, K. (2016). Nucleus accumbens D2R cells signal prior outcomes and control risky decision-making. Nature, 531. https://doi.org/10.1038/nature17400
Zhang, L., Liang, B., Barbera, G., Hawes, S., Zhang, Y., Stump, K., … Lin, D. T. (2019). Miniscope GRIN Lens System for Calcium Imaging of Neuronal Activity from Deep Brain Structures in Behaving Animals. Current Protocols in Neuroscience, 86(1), 1–21. https://doi.org/10.1002/cpns.56
Zhou, P., Resendez, S. L., Rodriguez-Romaguera, J., Jimenez, J. C., Neufeld, S. Q., Giovannucci, A., … Paninski, L. (2018). Efficient and accurate extraction of in vivo calcium signals from microendoscopic video data. ELife, 7. https://doi.org/10.7554/eLife.28728
Zong, W., Wu, R., Li, M., Hu, Y., Li, Y., Li, J., … Cheng, H. (2017). Fast high-resolution miniature two-photon microscopy for brain imaging in freely behaving mice. Nature Methods, 14(7), 713–719. https://doi.org/10.1038/nmeth.4305
Zucker, R. S. (1999). Calcium- and activity-dependent synaptic plasticity. Current Opinion in Neurobiology, 9(3), 305–313. https://doi.org/10.1016/S0959-4388(99)80045-2